May 6th, 2019
This is a Knowledge Base article, designed to streamline access to and share evidence about informal STEM learning. Knowledge Base articles are evidence-supported claims about what is new and emerging in the field that you can reference when you develop a proposal or “make the case” for a strategy or approach to funders and stakeholders.
Toni Dancstep (neé Dancu) co-authored this article, which is excerpted from Dancstep and Gutwill (2019). For further details on the research methods and findings, refer to the full text.
Over the past few decades, science center and museum educators have gathered much information about visitor engagement through individual studies at various museums. Several studies have found that groups or individuals tend to spend about a minute at the average science museum/center exhibit (Falk, 1983; Humphrey & Gutwill, 2005; Sandifer, 1997, 2003). However, such studies tended to be relatively limited, each investigating visitor engagement at a few dozen exhibits at most (e.g., Bailey, Bronnenkant, Kelley, & Hein, 1998; Garibay, 2013; Humphrey & Gutwill, 2005; Serrell, 1998, 2010). In fact, many studies have focused on mere handfuls of exhibits (e.g., Borun & Dritsas, 1997; Borun et al., 1998; Dancstep, Gutwill, & Sindorf, 2015; Falk, 1997; Perry, 1993, 2012). Do the results from these relatively small studies hold up when larger numbers of exhibits are investigated?
Recently, Dancstep undertook a comprehensive study of exhibits in order to identify designs that most successfully engage girls aged 8-13 years (without turning away boys). That project, called Exhibit Designs for Girls’ Engagement (EDGE), explored nearly 60 exhibit design attributes and found nine that consistently and significantly corresponded with positive engagement for girls in science museums (Dancstep & Sindorf, 2016, 2018).
After completing the study, we reanalyzed the engagement information for both girls and boys, averaged over 301 exhibits across three institutions. Our goal was to determine baseline levels for four aspects of engagement: exhibit use, time spent, exhibit returns, and engagement behavior. Here, we briefly describe the results of our reanalysis. Our hope is that these baseline results will act as a reliable benchmark for researchers and practitioners evaluating new exhibit designs.
Measuring Engagement
To measure engagement at interactive STEM exhibits, we chose a traditional tracking-and-timing methodology (Serrell, 1998, 2010; Yalowitz & Bronnenkant, 2009), which is an unobtrusive observation of participants as they move through a museum space.
The research team tracked a total of 906 children across 301 exhibits at three institutions: a large West Coast science center, a large Midwest science center, and a medium-sized Southwest science center. Pairs of researchers, blind to the study’s purpose, simultaneously tracked 15 percent of participants to check inter-rater agreement. For every exhibit, we explored four measures of engagement:
- Exhibit Use. Do children stop to use the exhibit? This base rate is the percentage of children in the study who touched an exhibit for three or more seconds or who stopped, feet planted, facing the exhibit for five or more seconds. Inter-rater agreement was 93 percent.
- Time Spent. How much time do children spend at the exhibit? To calculate time spent at an exhibit, we first summed the durations of all instances of exhibit use by each child at a particular exhibit. Next, we computed the average time spent for all children at that exhibit. Inter-rater agreement for time spent across all instances of exhibit use was 94 percent (Ferguson, 2009).
- Return Visits. Do children go back to use the exhibit again? Return visits was computed as the percentage of visitors who used an exhibit and who, after leaving, returned to use it again. Participants were considered to have returned to an exhibit if they met the requirements for exhibit use two or more unique times during their visit. Inter-rater agreement was 93 percent.
- High Engagement Level. Do children repeat, vary, or talk about aspects of their experience? For this measure, we drew on two existing metrics: the Exploratory Behavior Scale and the Visitor Engagement and Exhibit Assessment Tool (Barriault & Pearson, 2010; Van Schijndel, Franse, & Raijmakers, 2010). We used these metrics to create a three-point scale (low, medium, and high) that would provide a sense of the depth of children’s engagement at exhibits. Researchers recorded the highest level of engagement that each participant reached at each exhibit, from inattentive engagement to actively repeating, varying, or sharing their explorations. As the majority of children reached the “high” engagement level, the analysis determined the percentage of children who reached the “high” level of engagement. Inter-rater agreement was 92 percent.
For a general introduction to defining and measuring “engagement,” see the Knowledge Base article Considerations for Measuring Engagement in Informal Contexts and the CAISE interview series What is STEM Engagement?, both of which provide excellent overviews.
Resulting Baseline Levels
The following statistics offer a portrait of typical engagement levels at physics, engineering, math, time, and perception exhibits among 8–13 year olds across three representative museums. It is important to note that these results are more representative of engagement at the larger institutions in the study, which had a greater number of exhibits (i.e., the museum located on the West Coast, followed by the one in the Midwest). Indeed, over two-thirds of the exhibits were located at the West Coast museum. For the base rate results broken out by institution, see Dancstep and Gutwill (2019).
The following table shows the engagement data for children averaged across all exhibits. For example, at some exhibits, only two percent of children stopped to use the exhibit while other exhibits were used by 98 percent of children we tracked. When averaged across all exhibits the mean percentage of children who stopped was 22 percent. The same analysis was performed for the other three baseline variables. Averaged across all exhibits, the mean time children spent at an exhibit was 62.5 seconds. The mean percentage of children who returned to an exhibit they had already used was 15 percent. Finally, the average percentage of children who reached the highest level of engagement at an exhibit was 88 percent.
| Engagement Measure | Mean (Standard Deviation) | Minimum | Maximum |
|---|---|---|---|
| Use at Exhibits | 22% (16%) | 2% | 98% |
| Time Spent at Exhibits | 62.5 seconds (40.6 s) | 9.2 seconds | 273.9 seconds |
| Return Visits to Exhibits | 15% (9%) | 0% | 60% |
| High Engagement Level at Exhibits | 88% (10%) | 88% (10%) | 100% |
Contextualizing the Results
Attracting Power. Using an exhibit is a pre-requisite to any kind of engagement or deeper learning opportunities. Our analysis found that, averaging across exhibits, only 22 percent of children used a typical exhibit. This lies at the low end of prior findings in science exhibit attracting power, the ability of an exhibit to entice museum-goers to stop and try it. For example, Yalowitz and Bronnenkant (2009), describing a study of 44 exhibits in an aquarium exhibition, reported that the average exhibit attracted 41 percent of general visitors. Sandifer (2003) found that 38 percent of visitors of all ages stopped at the average science museum exhibit, among 61 exhibits spread across two exhibitions. However, Boisvert and Slez (1995) tracked visitors of all ages as they moved among 80 exhibits and discovered that only 19 percent stopped at the average exhibit. Perhaps there is an inverse relationship between the number of exhibits and their attracting power, or perhaps other differences in context or exhibits bear responsibility for the variation.
Holding Time. One of the most-studied aspects of the exhibit encounter is holding time (Sanford, 2010; Serrell, 1998, 2010; Yalowitz & Bronnenkant, 2009). As previously mentioned, the average visitor or group spends about one minute interacting with the average exhibit (Falk, 1983; Humphrey & Gutwill, 2005; Sandifer, 2003). The present analysis found the same result with children, providing strong replication and setting this base rate firmly in place. As new projects develop exhibits to deeply engage visitors (in contrast with projects that aim to provide a quick insight or discovery, e.g., Sanford, 2010), we suggest that they continue to use this result as a benchmark beyond which to push their own development.
Returns to Exhibit. We found that 15 percent of children returned to an exhibit after already using it. We believe return visits are important because they indicate that a visitor’s interest was deep enough that the person wished to experience something again, use something after observing someone else use it, or bring someone else over to show them an exhibit. We have been unable to find statistics from other researchers on return visits. In our own work studying geometry exhibits, we measured repeat use, but the tracking methods and number of exhibits in the study were so different that the findings are not comparable (cf. Dancstep, et al., 2015). Although this finding needs to be replicated with adults, it provides a benchmark for exhibits seeking to offer rich activities that inspire users to return and deepen their learning experiences.
Engagement Level. The vast majority of children, 88 percent, reached the highest level of engagement by actively repeating or varying inputs or sharing their experience with others. Our result is in line with other research that used or adapted Barriault’s Visitor Engagement and Exhibit Assessment Tool. (Note that our highest level incorporated both “transition” and “breakthrough” levels from Barriault’s scale.) For example, Barriault found that as many as 82 percent of visitors reached the “transition” level of engagement across six exhibits, while as many as 55 percent reached “breakthrough.” Similarly, Shaby, Assaraf, and Tal (2017) found that as many as 90 percent of the students they studied across nine science museum exhibits engaged in transition behaviors, and over 60 percent of them experienced breakthrough. This may suggest that hands-on, interactive science museum exhibits generally succeed at promoting basic inquiry behaviors. Still, further research on levels of minimum inquiry may be warranted in other types of informal learning institutions, such as history, natural history, art, and cultural museums.
Future Directions for Research
- Additional age groups. The baseline levels we found for use, time spent, returns, and engagement level came from a study of 8-13 year olds across 300+ exhibits at three representative science museums. Given the large number of exhibits in the study, we have confidence that the baselines accurately reflect children’s interactions with science museum exhibits. However, additional replication studies are needed to assess the exhibit interactions of preschool children, teenagers, and adults.
- Varying institutional size and number of exhibits. We found that about 22 percent of children used the average exhibit. However, this figure fluctuated across the three museums. In the spaces with fewer exhibits, a larger percentage of children used each exhibit. Our review of the literature also found substantial variation in exhibit use across studies, from 19 percent to 41 percent. Taken together, these findings suggest that future research should focus on tracking visitors in spaces of different sizes and numbers of exhibits.
- Exhibit density and other environmental considerations. Our finding that children spend about one minute at the average exhibit agrees with findings from other studies, which boosts its validity. However, we did find some differences among the institutions; spaces that had low exhibit density showed greater holding time. Research on environmental design in museums has found that visitors tend to spend more time on average at exhibits that are surrounded by walls than at those that are situated in larger, more open spaces (Adamson, 2008; Allen, 2004). Perhaps visitors become more focused when their visual field around a group of exhibits is uncluttered.
- Exploring the patterns of “return visits.” Our study offered an initial base rate for the percentage of children who return to an exhibit after having used it (15 percent). This finding requires replication, as so few other studies have measured this indicator of engagement in museums. In addition to replication, future studies must assess exhibit returns among adults, as children and adults may have different patterns of use-reuse, especially when they are visiting in groups. For example, children may act as “scouts,” trying exhibits and then leaving to fetch other group members.
- Exhibits engage children. Finally, we found that a very high fraction (88 percent) of children performed basic inquiry behaviors at the exhibits. This probably reflects the high level of effort that the three museums put into successfully developing hands-on, interactive exhibits. Still, the findings demand further replication in this area, especially with adults.
We hope these results add to the field’s understanding about how children engage with science museum exhibits and that they will point other researchers in fruitful directions.
This material is based upon work supported by the National Science Foundation (NSF) under grant no. 1323806. Any opinions, findings, and conclusions or recommendations expressed in this material are those of the authors and do not necessarily reflect the views of NSF.
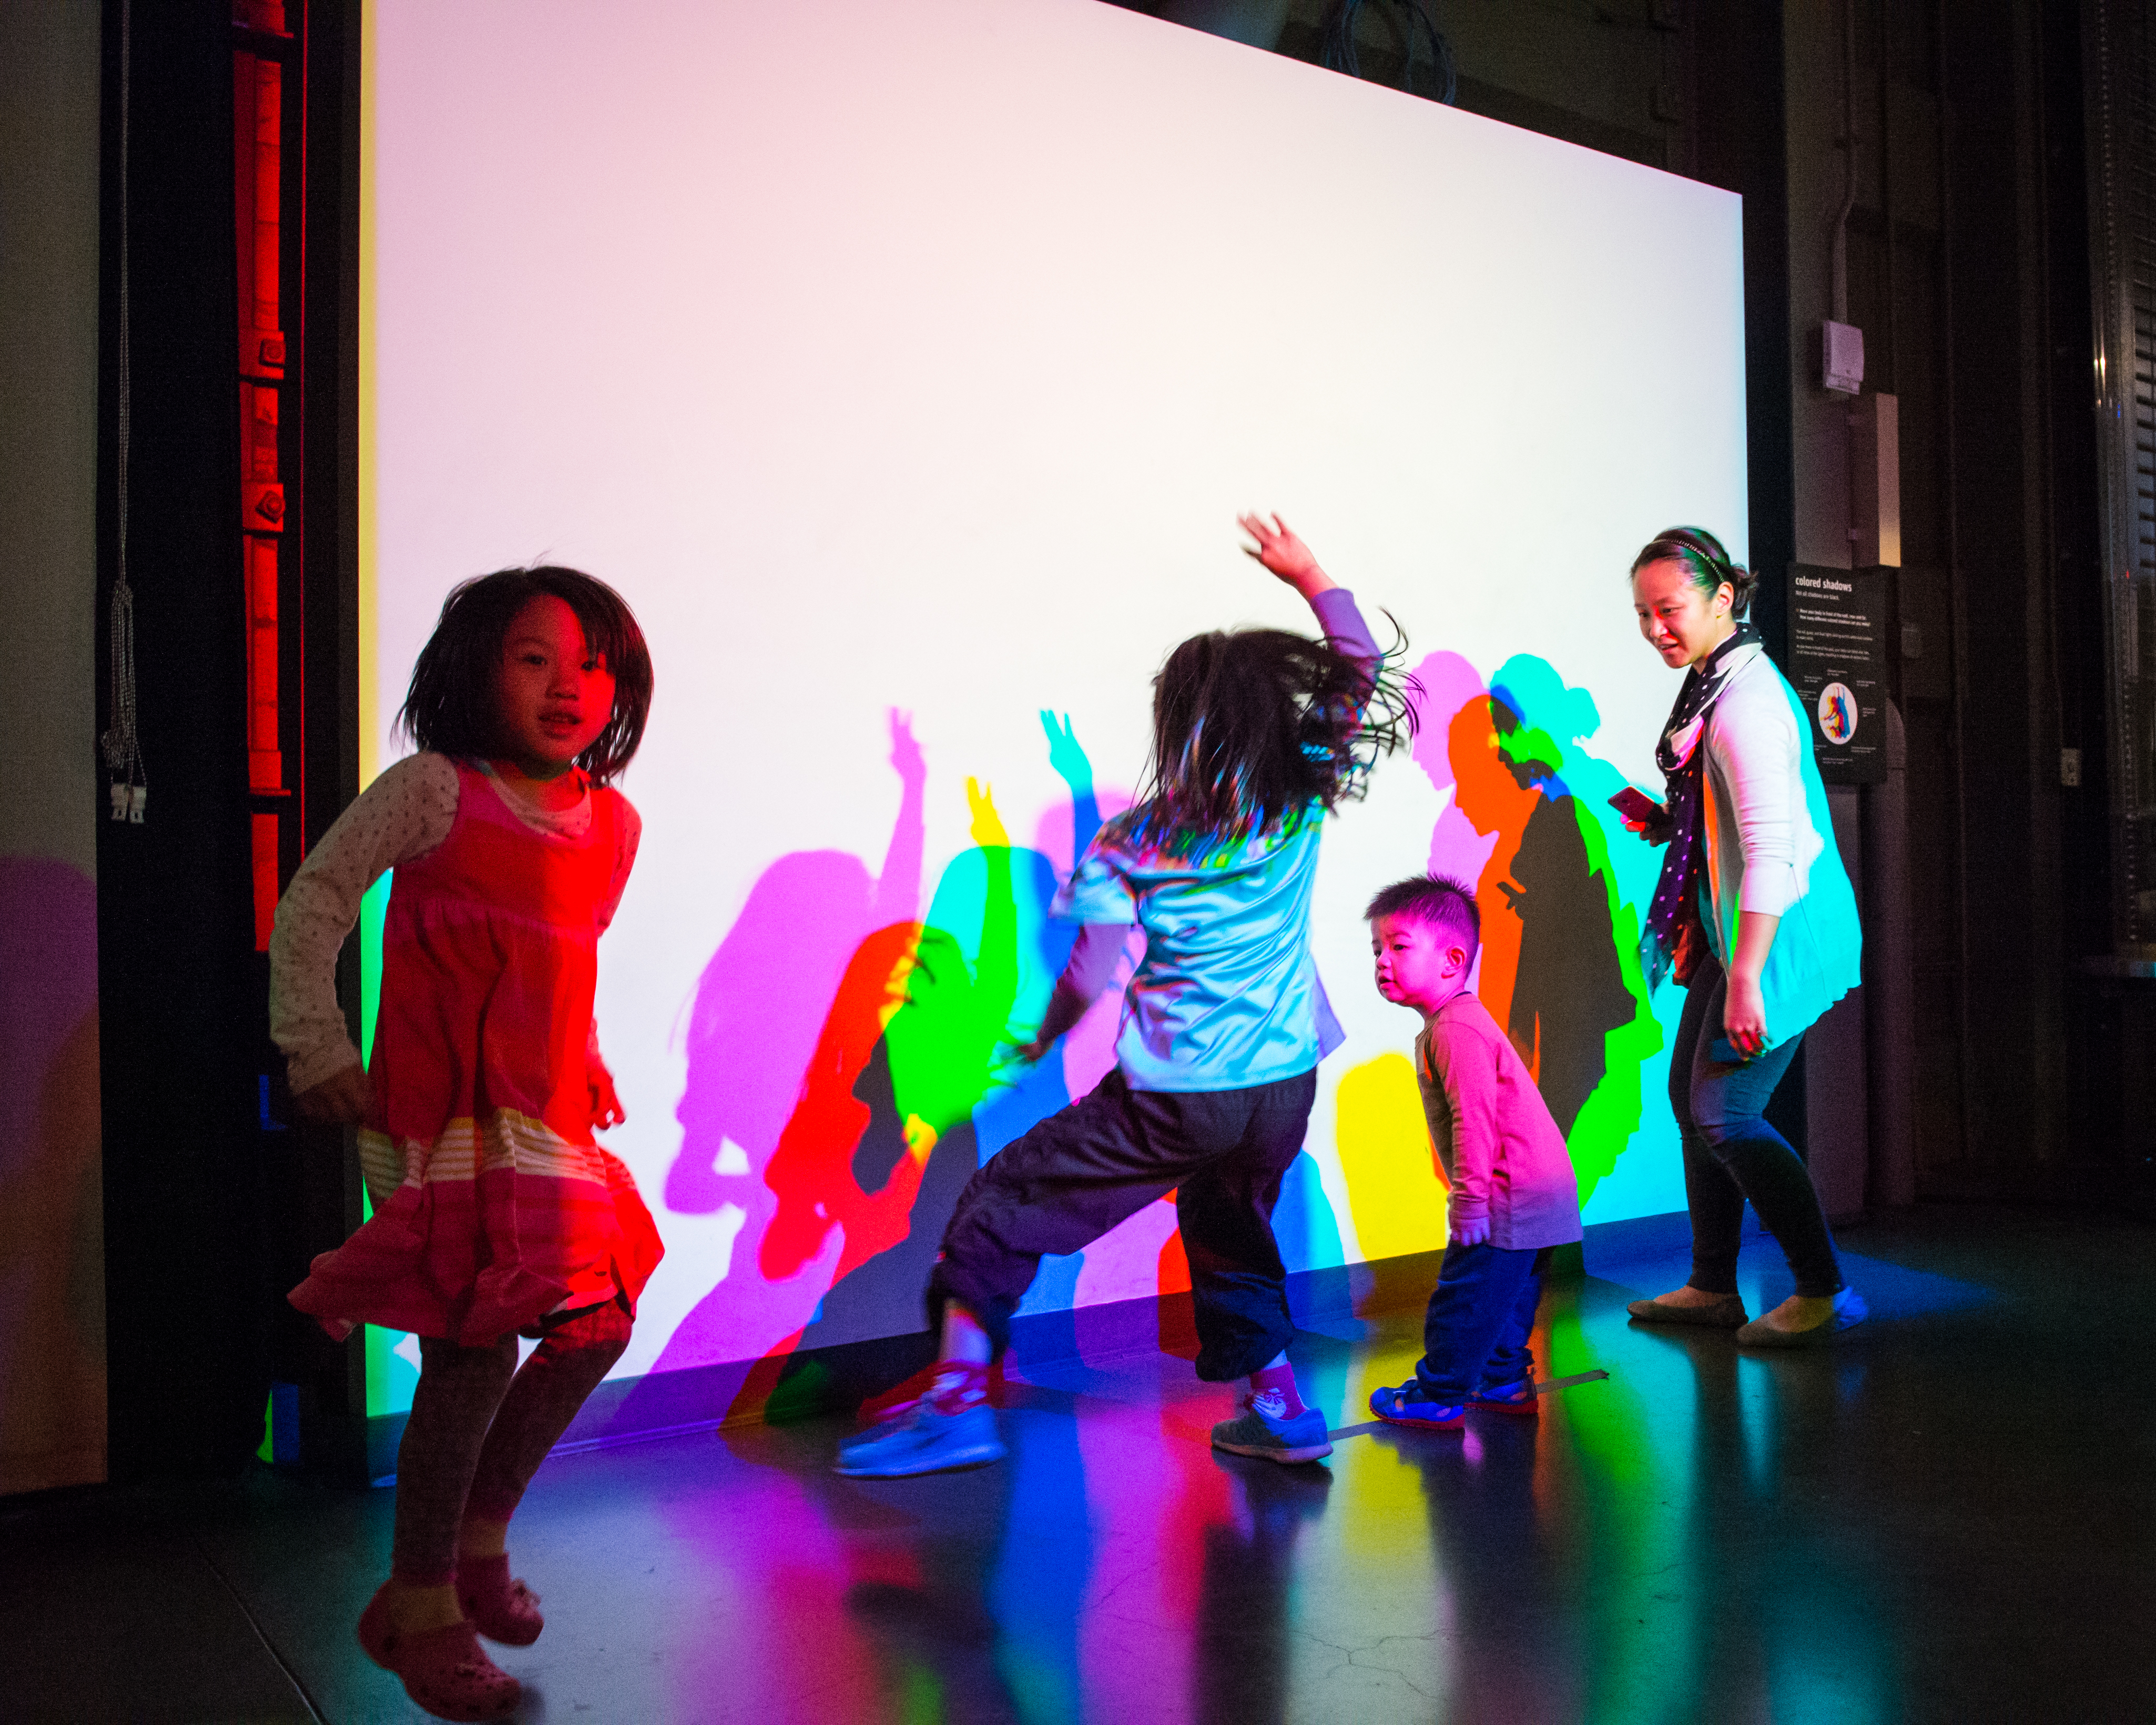
Photo courtesy of Amy Snyder and Gayle Laird, © Exploratorium
References
Adamson, B. (2008). The relationship between exhibition environments and visitors’ behaviors. Paper presented at the Visitor Studies Association, Houston, TX.
Allen, S. (2004). To partition or not to partition: A study of the impact of walls on visitor behavior at an exhibit cluster. Paper presented at the Visitor Studies Association, Albuquerque, NM.
Association of Science-Technology Centers. (2016). ASTC Statistics Package. Washington, D.C.
Bailey, E., Bronnenkant, K., Kelley, J., & Hein, G. (1998). Visitor Behavior at a Constructivist Exhibition: Evaluating Investigate!at Boston’s Museum of Science. In C. Dufresne-Tassé (Ed.), Évaluation et éducation muséale; nouvelles tendances / Evaluation and Museum Education: New Trends / Evalacion y educacion museistica: Nuevas tendencias(pp. 149–168). Montreal: ICOM/CECA.
Barriault, C., & Pearson, D. (2010). Assessing exhibits for learning in science centers: a practical tool. Visitor Studies, 13(1), 90-106. doi: 10.1080/10645571003618824
Boisvert, D. L., & Slez, B. J. (1995). The relationship between exhibit characteristics and learning-associated behaviors in a science museum discovery space. Science Education, 79(5), 503-518.
Borun, M., & Dritsas, J. 1997. Developing family-friendly exhibits. Curator, 40(3), 178-192.
Borun, M., Dritsas, J., Johnson, J. I., Peter, N. E., Wagner, K. F., Fadigan, K., Jangaard, A., Stroup, E., & Wenger, A. (1998). Family Learning in Museums – The PISEC Perspective. Washington D.C.: National Science Foundation.
Dancstep, T. & Gutwill, J. P. (2019). Towards disrupting the status quo of exhibit design: A data reanalysis to support future research.San Francisco, CA: Exploratorium. 47 pages.
Dancstep, T., Gutwill, J. P., & Sindorf, L. (2015). Comparing the visitor experience at immersive and tabletop exhibits. Curator, 58(4), 401-422.
Dancstep, T., & Sindorf, L. (2016). Exhibit Designs for Girls’ Engagement: A guide to the EDGE design attributes.San Francisco: Exploratorium.
Dancstep, T. & Sindorf, L. (2018). Exhibit Designs for Girls’ Engagement (EDGE). Curator, 61(3), 485-506.
Falk, J. H. (1983). Time and behavior as predictors of learning. Science Education, 67(2), 267-276.
Falk, J. H. (1997). Testing a museum exhibition design assumption: Effect of explicit labeling of exhibit clusters on visitor concept development. Science Education, 81(6), 679-688.
Ferguson, C. (2009). An effect size primer: a guide for clinicians and researchers. Professional Psychology: Research and Practice, 40(5), 532-538.
Garibay, C. (2013). Design Zone Exhibition Summative Report. Chicago, IL: Garibay Group.
Humphrey, T., & Gutwill, J. P. (Eds.) (2005). Fostering Active Prolonged Engagement: The Art of Creating APE exhibits. Walnut Creek: Left Coast Press.
Perry, D. (1993). Experiment Bench Project: Summative Evaluation Report. Science Museum of Minnesota.
Perry, D. (2012). What Makes Learning Fun? Principles for the Design of Intrinsically Motivating Museum Exhibits. Lanham, MD: AltaMira Press.
Sandifer, C. (1997). Time-based behaviors at an interactive science museum: Exploring the differences between weekday/weekend and family/nonfamily visitors. Science Education, 81(6), 689-701.
Sandifer, C. (2003). Technological novelty and open-endedness: Two characteristics of interactive exhibits that contribute to the holding of visitor attention in a science museum.Journal of Research in Science Teaching, 40(2), 121-137.
Sanford, C. W. (2010). Evaluating family interactions to inform exhibit design: comparing three different learning behaviors in a museum setting. Visitor Studies, 13(1), 67 – 89.
Serrell, B. (1998). Paying attention: Visitors and museum exhibitions. Washington, D.C.: American Association of Museums.
Serrell, B. (2010). Paying more attention to paying attention. Center for Advancement of Informal Science Education.
Shaby, N., Assaraf, O., & Tal, T. (2017). The particular aspects of science museum exhibits that encourage students’ engagement. Journal of Science Education and Technology, 26, 253-268.
Van Schijndel, T. J. P., Franse, R. K., & Raijmakers, M. E. J. (2010). The Exploratory Behavior Scale: Assessing young visitors’ hands-on behavior in science museums. Science Education, 94(5), 794-809. doi: 10.1002/sce.20394
Yalowitz, S. S., & Bronnenkant, K. (2009). Timing and tracking: unlocking visitor behavior.Visitor Studies, 12(1), 47-64. doi: 10.1080/10645570902769134