Science on a Sphere: A Global Network Celebrates 100 Installations
The National Oceanic and Atmospheric Administration (NOAA) recently opened the 100th Science On a Sphere® installation at its headquarters in Silver Spring, MD. Science On a Sphere is an interactive 3D display system for scientists, educators, and the general public to simulate and interact with planetary data. The Sphere’s origins were discussed in a recent interview with Alexander (Sandy) MacDonald, Ph.D., director of the NOAA Earth System Research Laboratory in Boulder, Colorado and inventor of Science On a Sphere®.
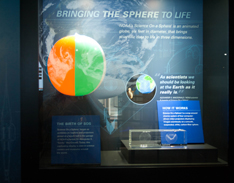
The "Birth of SOS" exhibit case pictured at NOAA Headquarters. Photo credit: NOAA
It was the summer of 1995. I was driving home one day and wondered why people hadn’t displayed things on a sphere. My brother told me a long time ago, things you think that others have done, a lot of times they haven’t. How can I help children and the public better understand the Earth? That evening, MacDonald opened an optics textbook, painted a beach ball white, and began experimenting with projectors. He wondered, How big can I get this thing? To help solve this problem, and other challenges involved with projecting on a sphere, MacDonald invited a talented engineer, David Himes, to discuss the project with him. Himes became the original lead software engineer on the project whom, along with others, engineered, developed, and integrated all of the software and hardware components used to create a Science On a Sphere® system. A patent was awarded to NOAA for Science On a Sphere® in August 2005, with Dr. MacDonald credited as the inventor. [1] Now constructed of carbon fiber, Science On a Sphere® installations are seen by 33 million people annually in 15 countries, 27 U.S. states, the District of Columbia, and American Samoa. [2] Most of the systems are installed in science centers and museums. International installations have increased over recent years, particularly in Mexico and across Asia. A full listing of Science On a Sphere® installations is available from its website.
Science On a Sphere® Data Sets
Science On a Sphere® boasts 400 data sets and simulations, originating from NOAA, NASA, universities, science centers, and other organizations. The data sets are divided into the broad categories of Atmosphere, Ocean, Land, and Astronomy. Educational materials have been developed to accompany data sets with a current emphasis on creating lesson plans and engagement strategies that connect the experience of visiting Science On a Sphere® with the classroom. I hadn’t fully appreciated how important it is to put thought and resources into telling the world [about their science]. The scientists just want to work on their science, and no one knows about their great discoveries. This [Science On a Sphere®] is a tool to tell the world.
- Dr. Alexander “Sandy” MacDonald
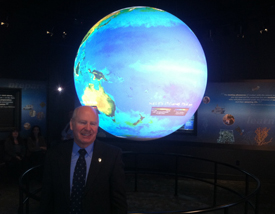
Dr. Alexander "Sandy" MacDonald pictured with the 100th Science On a Sphere®. Photo credit: Trevor Nesbit
With Science On a Sphere®, scientists working at the NOAA headquarters can live stream data sets and simulations for real time simultaneous display across a network of installations, called SphereCast. SphereCast events have connected audiences in Hawaii’s Bernice Pauahi Bishop Museum with scientists broadcasting from University of California Berkeley’s Lawrence Hall of Science, and NOAA’s Pacific Tsunami Warning Center. With public audiences in both locations, scientists and educators have displayed and discussed data sets and simulations, including the Chilean Tsunami that occurred on February 27, 2010. [3] [4] An upcoming SphereCast will explore the 1964 Great Alaskan Earthquake and Tsunami sometime around the 50th Anniversary of that event in March 2014. [5] This SphereCast network capability and scientist/informal science education professional collaboration offers both science outreach and public engagement opportunities on a global scale. In the future, MacDonald and NOAA's Office of Education staff hope to incorporate next generation global prediction models into the Sphere to be able to communicate about events before they occur. The NOAA's Office of Education would also like to see additional cross-agency collaboration to develop data sets and simulations, especially in the life sciences and social sciences. These types of data layers could enable inquiry, storytelling, and a global perspective on a range of societal issues where humans are directly involved at the interface of science and the public, described Carrie McDougall, a Senior Education Program Manager at NOAA’s Office of Education.
Who Contributes to the Sphere?
In addition to numerous contributions of original datasets by Science On a Sphere® Network members, including fully produced "auto-run" movies, docent scripts, and related education materials, the flexibility of the sphere also enables developers to create software to display user created 3D interactive content. The sphere can be thought of as a flexible 3D graphics platform for learning with cyberinfastructure. [6] For example, as part of the project Math on a Sphere (NSF 1114388), PIs Michael Eisenburg and Sherry Hsi are prototyping, designing, implementing, testing, and evaluating software for youth to build and display geometric patterns on an installed sphere. Youth participants can also work remotely on the project and test their mathematical computations by viewing the spherical display remotely either through a computer monitor or a camera view of the sphere itself. [7] NOAA staff have observed that the most impactful interactions with the sphere are mediated by an interpreter who can scaffold different levels of engagement. The Math on a Sphere project is an early use of the sphere technology for interactive 3D display of user-produced science content. The trajectory of this work is toward the interactive use of 3D public display systems (ibid). The reaction to incorporating user-contributed data and simulations into Science On a Sphere® has been tremendous, said McDougall. NOAA’s Office of Education hopes that programs like these lead to more direct interaction with the sphere, including ways to incorporate more user-generated content and learning opportunities across the network of installations.
Evaluation
Program-wide summative evaluation of spheres conducted by the Institute for Learning Innovation have indicated that:
- Facilitation correlates with learning: 87% of visitors who had a facilitated sphere experience reported learning something new.
- Visitors report that seeing information on the sphere is more realistic and provides more perspective: 82% of visitors stated that visualizing information on the sphere changed how they understood the information.
- When asked if they had learned something new, 71% of interviewees responded they had and were able to provide specific examples of what they had learned. [8]
More evaluation information related to the sphere, including reports from locally-conducted evaluations, summaries from interviews, questionnaires, and visitor tracking data can be found on NOAA’s Office of Education website.
How Do I Get Science On a Sphere®?
Science On a Sphere® is patented "turn key" technology available for purchase. The Science On a Sphere® website offers resources and guides for setting up, maintaining, and running the sphere once it has been installed. For more information see Getting Science On a Sphere. Funding through the NOAA Office of Education's Environmental Literacy Grant program, which has supported installations in prior years, is currently uncertain. Typically NOAA would alternate annual competitive award opportunities to serve both formal and informal users. NOAA program managers hope that there will be future funding opportunities and will announce them as soon as they are available. Current opportunities will be listed on the InformalScience.org funding calendar.
References
Top photo credit: Will von Dauster, National Oceanic and Atmospheric Administration
[1]”What is Science On a Sphere®?” National Oceanic and Atmospheric Administration. http://sos.noaa.gov/What_is_SOS/about.html
[2] “NOAA’s stunning Science On a Sphere® now in 100 locations worldwide” National Oceanic and Atmospheric Administration. Retrieved from: http://www.noaanews.noaa.gov/stories2013/20131122_sos.html
[3] “Bishop Museum Teams Up With Pacific Tsunami Warning Center For Tsunami Spherecast” Bernice Pauahi Bishop Museum.
[4] “Tsunami Event – February 27, 2010 Chile” National Oceanic and Atmospheric Administration. http://nctr.pmel.noaa.gov/chile20100227/
[5] Sokolowski, T. The Great Alaskan Earthquake & Tsunamis of 1964. NOAA West Coast and Alaska Tsunami Warning Center. Palmer, AK.
[6] Borgman, C., Abelson,H., Dirks, L., Johnson, R., Koedinger, K., Linn, M., Lynch, C., Oblinger, D., Pea, R., Salen, K., Smith, M., & Szalay, A. (2008.) Fostering learning in the networked world: The cyberlearning opportunity and challenge. Report of the NSF Task Force on Cyberlearning. Washington, DC. National Science Foundation. Retrieved from: http://www.nsf.gov/pubs/2008/nsf08204/nsf08204.pdf
[7] “Math on a Sphere” Retrieved from: http://informalscience.org/projects/ic-000-000-001-828/Math_on_a_Sphere:_An_Interactive_Exploration_of_3D_Surfaces_for_Public_Audiences
[8] Goldman, K.H., Kessler, C., & Danter, E. (2010.) Science On a Sphere® Cross-Site Summative Evaluation. Edgewater, MD. Institute For Learning Innovation. Retrieved from: http://www.oesd.noaa.gov/network/SOS_evals/SOS_Final_Summative_Report.pdf