Paying More Attention to Paying Attention
Edited July 8, 2016. Download a .pdf copy of this article.
Attention is a scarce resource—perhaps the most precious scarce resource there is.
- Csikszentmihalyi and Hermanson, “Intrinsic Motivation in Museums: What Makes Visitors Want to Learn?”
Introduction
In 1998 I wrote Paying Attention: Visitors and Museum Exhibitions, a book supported by a National Science Foundation (NSF) grant called “A Meta-analysis of Visitor Time/Use in Museum Exhibitions.” The grant accomplished three main goals:
- Created a database of tracking-and-timing studies of visitor use of 110 educational exhibitions
- Generated new metrics for analyzing and interpreting tracking-and-timing data
- Established parameters of relative success for thoroughly used exhibitions.
Since Paying Attention, tracking-and-timing (T&T) findings have become increasingly important and useful. In this report, I will present additional data and discuss the uses, implications, and how analysis of these data can inform practitioners in the planning and evaluation of exhibitions as well as other forms of informal science education (ISE) programs. Attracting and holding people’s attention is obviously a goal for most ISE endeavors.
A Brief Background
Unobtrusive observations of visitors as they move around an exhibition—interacting with each other and with the exhibit elements—give important information about what visitors do, especially how much time they spend in the exhibition and with what parts of the exhibition they become engaged.
Time spent paying attention is a prerequisite for learning, and studies have shown a positive relationship between the amount of time spent in an exhibition and learning (Borun, et al. 1998). “Visitors are choosing where to spend every second of their time, and exhibits that do not engage them are quickly left behind, however ‘potentially educational’ they may be” (Allen 2002). Spending more time overall, talking about the exhibits, and reading label texts aloud to each other are three highly predictive behaviors for learning in exhibitions.
Visitor studies researchers use these observations and data as a method for summatively evaluating museum exhibitions, almost always in tandem with other methods, such as exit interviews and questionnaires. (1)
Tracking-and-timing (T&T) data, as well as the process of gathering it, are useful for professional development, comparative research, and planning. Systematic observations of visitors as they use exhibits provide museum professionals with a firsthand look at real visitor behaviors, not theoretical ones. Exhibit development staff members become more sympathetic to the number of choices visitors have to make, how much effort it takes for them to read standing up while keeping track of their children or friends, and the amount of time it takes to look at a large number of exhibit elements.
Unobtrusively observed visitor behavior is a relatively quick and easy way to introduce practitioners to a hands-on systematic research technique that can yield tangible data that raise important questions: What parts of the exhibition were the most engaging to which kinds of visitors? Were there some exhibits with low engagement levels that could be easily improved to increase their attractiveness or comprehensibility for multigenerational audiences? Are there ways to increase visitors’ intentionality through better advertising or introductory information?
Data for the analysis and comparison of T&T studies include:
- size of the exhibition (square footage)
- number of exhibit elements
- total time spent in the exhibition by a random sample of casual adult visitors
- average amount of time spent by the sample of visitors
- attraction rate for each exhibit
- number of stops visitors made
- amount of time spent at each stop
We also record observable demographic information about the visitors in the sample (e.g., approximate age, gender, social-group size and type).
There are challenges for the definitions and calibration of every measure listed here, but enough visitor studies researchers have used them with similar definitions to allow for interesting comparisons among data from different studies. In addition to summative evaluations, museum professionals have used T&T data to compare their traveling exhibitions at different sites (Serrell 2004a; Cohn 2009; Tisdal 2007) and to compare the impacts of different exhibitions at the same site (Yalowitz 2006, Gutwill 2000).
Tracking data can also help set goals and compare old exhibitions with their renovations (Ross 2005, Yalowitz 2004, Serrell 2009). Another use is to make predictions about visitor behavior and compare the findings to assumptions and intentions (Sikora 2009).
Given the high variability of the exhibitions studied, the patterns that have emerged are robust. Three overarching findings from the database are: the relatively brief duration of museum exhibition visits (an average of 20 minutes), the tendency for smaller exhibitions to be explored more fully by visitors, and a trend for science museums to have underused exhibitions.
T&T Studies Can Challenge and Support Other Data
T&T data has confirmed or disputed assumptions and expectations about intended outcomes or conventional wisdom. For example, interactive exhibits are often assumed to be the most popular elements in an exhibition. T&T data from the Water exhibition and RACE Are We Different? showed surprisingly high levels of visitor attention to text and graphic panels, challenging the assumption that “nobody reads the labels.”
The concept of museum fatigue suggests that exhibit elements later in an exhibition will get less attention than the ones in the beginning. This is often true, but in an exhibition of artworks, artifacts, medical specimens, interactive exhibits, and biometrics software called Revealing Bodies at the Exploratorium in San Francisco, Josh Gutwill reported an unusually high stay time overall. “We also found that visitors spent approximately the same amount of time in each section of the exhibition, indicating that there was not a strong fatigue effect” (Gutwill 2000).
Other kinds of summative evaluation methods provide evidence that T&T data are valid indicators not only of engagement but of memorable experiences. The open-ended questions in the exit interviews for Revealing Bodies reinforced the findings from the tracking studies: “Visitors spontaneously mentioned 37 (43%) of the exhibits, most of which were the same exhibits that showed high attracting power in the tracking study” (Gutwill 2000). This corroboration of frequently mentioned exhibits with high attraction rates has been noted in other studies as well (Borun 2007, Randi Korn & Associates 2007a, Serrell 2009).
Exhibition studies that take place in multiple locations allow for unique comparisons and considerations of the variables of audience and layout. Memory, created by the Exploratorium, was a traveling exhibition about the biological, psychological, and cultural aspects of how we remember things. Evaluations conducted as the exhibition went to the Missouri Historical Society, Reuben H. Fleet Science Center, and the Utah Museum of Natural History showed that many of the same exhibit elements were ranked most attractive, evidence of successful design for broad appeal (Serrell 2004a).
But the overall data (time spent and stops made) for Memory were relatively lower at the Fleet Science Center compared to the findings at the natural history and history museums. This was also true for Water at the Science Museum of Minnesota compared to its data at the American Museum of Natural History (Cohn 2009). For the traveling exhibition Invention at Play, Randi Korn reported, “Visitors observed at National Museum of American History made more stops and displayed more exhibit-related behaviors than did those at the Museum of Science” in Boston (Randi Korn & Associates 2004). Memory and Water had more open layouts at their science museum installations compared with floor plans at the other sites that had a single entry and exit.
Besides a broad overview, tracking and timing can provide a close-up look at how individual parts of the exhibition are working. Many studies have documented the low use of introductory panels (Yalowitz 2004, McNamara 2005, Randi Korn & Associates 2004, Meluch 2006) and the positive impact on visitor behavior and outcomes when people did use the introductory information (Selinda Research Associates 2002) or brochure (Randi Korn & Associates 2007b). In another study, visitors’ use of the section labels led to a more effective design of these panels in the next show at the same museum (Serrell 2005). Data from video-watching behavior has led to the conclusion that 30% of visitors typically stop to look at a video and fewer stay for the whole thing (Serrell 2002). This has implications for exhibitions that count on videos to deliver a main message.
Analysis of Tracking-and-Timing Date for "Thorough Use"
In the 1998 meta-analysis of 110 tracking and timings that established a baseline of descriptive statistics for a wide variety of exhibitions, I introduced two new metrics: the sweep rate index and the percentage of diligent visitors.
Sweep rate index (SRI) is calculated by dividing the exhibition’s square footage by the average total time spent there for a tracked sample of casual visitors. A lower sweep rate means that visitors spent more time in the exhibition and were engaged in more learning-related behaviors.
Diligent visitors (%DV) is the percentage of visitors in the tracked sample who stopped at more than one-half of the exhibit elements in the exhibition. Higher percentages of diligent visitors mean that more people were paying attention to more exhibits, and fewer exhibit elements were being ignored, skipped, or missed.
Together, SRI and %DV form the concept of a “thorough use” for summatively assessing the effectiveness of an exhibition. Thoroughly used exhibitions are those in which visitors stay a long time and are engaged with a large proportion of the exhibit elements.
Figure 1 gives a visual representation for thorough use by plotting the SRI and %DV for 50 different exhibitions on a scattergram. These 50 samples are in addition to the 110 samples presented in the 1998 study.
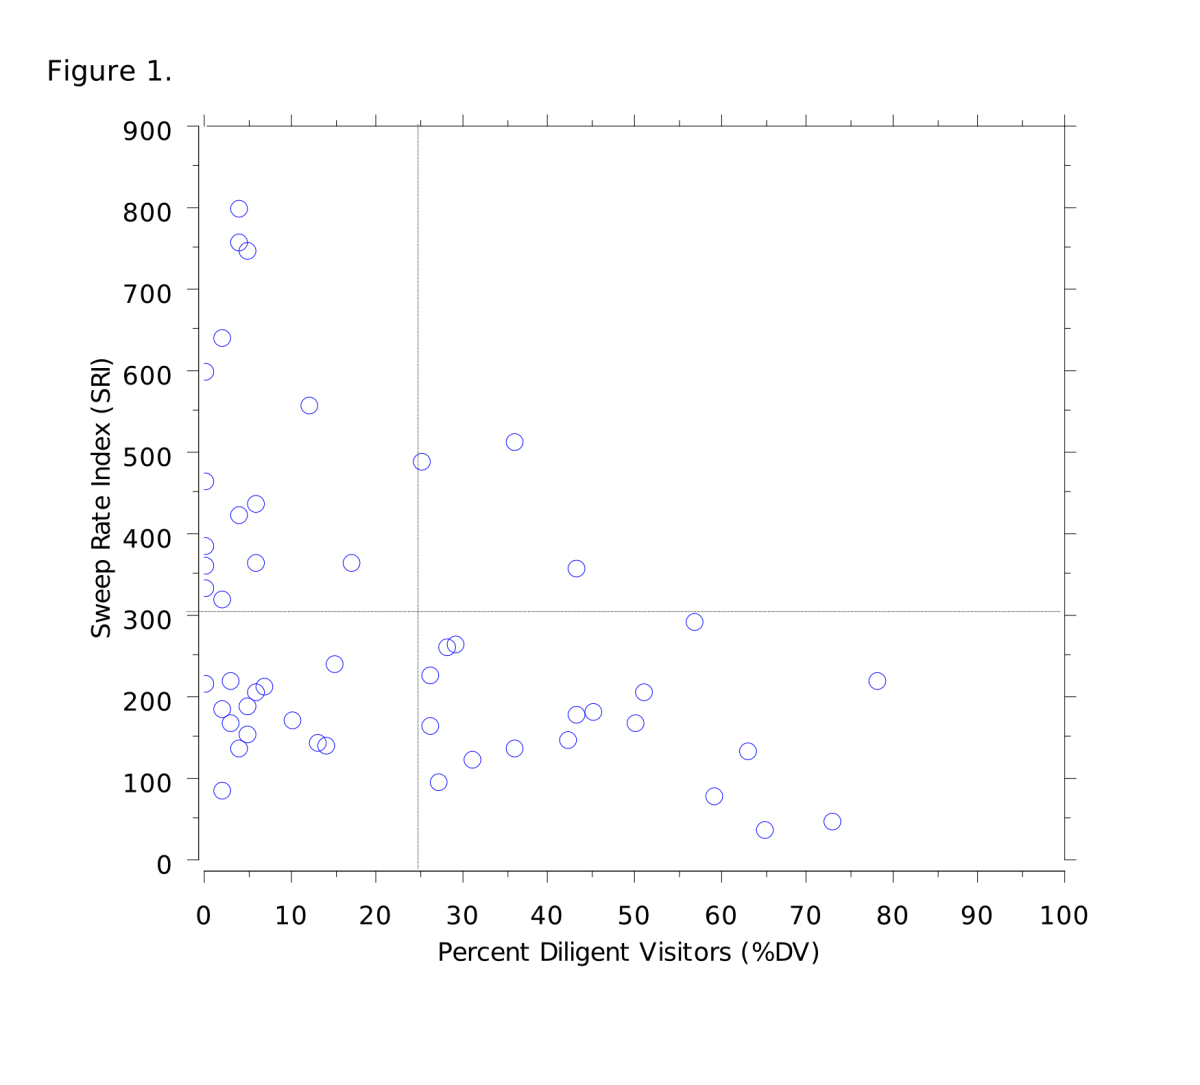
Each dot represents one exhibition. The least-thoroughly used exhibitions are in the upper-left section; the most-thoroughly used exhibitions are in the lower-right section of the scattergram.
The sample of 50 T&T studies represented on this scattergram, many of which were discussed above, includes those available on informalscience.org and ExhibitFiles.org, or studies shared with me by visitor behavior researchers from in-house files. As such, it is a sample of convenience, not a random sample of all summative evaluations done in the last 10 years. The sample of exhibitions is diverse—including science, natural history, cultural history, art, and interdisciplinary topics, and ranging in size from 1,200 to 25,000 square feet. The use of informalscience.org as a resource (the only one of its kind) for this article’s database has, notably, resulted in more science-related topics and sites.
Meta-Scattergram Quadrants A, B, C, and D
I have divided the meta-scattergram into four quadrants, based on the summary data and the cluster patterns in which the average value for SRI is 300 and the average %DV is 26.
Quadrant A: Upper-left quadrant (SRI of 300 and more, %DV less than 26)
Quadrant B: Upper-right quadrant (SRI of 300 and more, %DV 26 and more)
Quadrant C: Lower-left quadrant (SRI of less than 300, %DV less than 26)
Quadrant D: Lower-right quadrant (SRI of less than 300, %DV 25 and more)
I will discuss each quadrant separately, with specific examples of how the concept of thorough use applies to them. To allow readers to examine the data according to their own questions, I have included the complete set of exhibition data in the Appendix in an Excel document.
Quadrant A: Been There, Done That
The 17 least-thoroughly used exhibitions were found in natural history and general museums as well as in living collections; three-quarters of those were in science museums/centers. There were more large exhibitions—both in square footage and in the number of elements. Summative evaluation reports for these exhibitions revealed different ways of interpreting this underutilization and what the museum might do about it.
The least-used exhibition was the Hall of Mammals at the Smithsonian Institution’s National Museum of Natural History, a vast display wtih an open and nondirective floor plan. The SRI was 1,923 (25,000 square feet of exhibits divided by an average time of 13 minutes), a definite outlier that was more than twice as high as the next highest sweep rate of 800. (It is so high that it does not fit on the Figure 1 meta-scattergram.) The Hall of Mammals report actually celebrated the rapid use of the hall as evidence for appropriate intended behavior by visitors who are making a whirlwind tour of the Smithsonian. The exhibition “functioned well for the many visitors who were in a hurry and wanted to see as much as possible in as short a time as possible” (Pekarick 2005). Fortunately, most institutions do not have the same challenges as the museums on the National Mall, where visitors race through the halls with a checklist approach.
On the other hand, exhibit developers at the Grand Rapids Public Museum used tracking and timing to see how visitors were using their large 19-year-old Furniture City (800 SRI and 4%DV) in anticipation of making major renovations. Systematic observations confirmed the staff and docents’ experience: Some visitors literally ran through it. Yet the data from the exit questionnaires showed that visitors valued and understood the main ideas and thought Furniture City was important (Serrell 2009). The developers plan for a more thoroughly used, and perhaps smaller, exhibition in the future.
McNamara’s summative evaluation of Amazing Feats of Aging at the Oregon Museum of Science and Industry—using a combination of T&T, interviews and questionnaires—was one of the few reports of an apparently underutilized exhibition to admit that the data were less than hoped for: “The study’s findings underscore Amazing Feats of Aging’s potential educational and affective impact for both adults and children. Unfortunately, tracking-and-timing data indicate that few casual (or ‘noncued’) interactions will be sufficiently intense or sustained to make such communication possible” (McNamara 2005).
For evaluating exhibitions the National Science Foundation’s Framework for Evaluating Impacts of ISE Projects (Friedman 2008) recognizes that it is not realistic to expect large learning impacts from a 20-minute visit, but that “a cumulative model of learning, with experiences designed to build on or reinforce each other” is not beyond control of an exhibit project team (Allen 2008). Exhibitions with fewer choices of experiences that can be accomplished in a relatively brief time and that convey cohesive content will be more likely to maximize their impacts. (Examples of these will be seen in Quadrant D.)
Quadrant B: Really Large Real Estate
This quadrant has exhibitions with dioramas or large tanks—exhibit elements that take up a lot of square footage but do not hold visitors for proportionally longer times. There were only three such exhibitions in the current sample, including the dioramas section of Exploring Life on Earth. As concluded in the 1998 study, dioramalike exhibit elements have sweep rates that are often not comparable to other types of exhibitions. Museums with these types of layouts, however, can compare their exhibitions within the institution, as Monterey Bay Aquarium has done extensively, including Sharks: Myth and Mystery and Jellies: Living Art (which falls on the line between Quadrant A and B).
Quadrant C: Too Much Information
The lower-left quadrant contains 14 exhibitions, half of them science topics and many of them with lots of elements. Twelve of the 14 had more than 50 elements. Hudson Riverama packed 96 exhibits into 2,500 square feet; there were 106 in Yuungnaqpiallerput, which was just over 5,000 square feet. People were using the spaces slowly, most averaging more than 20 minutes. In some cases, the slow sweep rates (longer dwell times) were because visitors sat down to watch engaging videos (Surviving: The Body of Evidence), played with computer interactives (Search for Life Beyond Earth), or waited in line to use an exhibit (Moneyville). But most people stopped to look at fewer than one quarter of the exhibits. Some elements failed to attract a single person. In Invention At Play, 26 of the 83 exhibits attracted less than 5% of the audience.
Only three of the Quadrant C exhibitions were permanent installations — Beautiful Science: Ideas That Changed the World, a history of science exhibition at the Huntington Library, Search for Life at the New York Hall of Science, and Hudson Riverama, at the Hudson River Museum—in which visitors might actually have a chance to make a return visit to see exhibit elements they missed the first time.
Quadrant D: Stayed, Engaged, Lots
There are proportionately fewer science museum exhibitions in this quadrant with 18 data points.
Secrets of Circles was one of the few children’s museum exhibitions included in the database, and it showed similar trends and variables seen in exhibitions meant for families: “Visitors of different ages, group sizes, genders, and prior experience with the exhibition all spent a similar amount of time, showing a broad spectrum of extended engagement” (Allen 2007). Exhibits in Secrets of Circles had been extensively prototyped, used a range of modalities, were thoughtfully designed to appeal to adults as well as to children, and were in a bounded space. “Several adults commented on their appreciation of the enclosed space, where children could spend more time with less distraction” (Allen 2007). This affordance apparently worked well for adults, too.
Chicago Sports and Teen Chicago were temporary exhibitions created by the Chicago History Museum. Both had slightly higher-than-average %DV, and visitors tracked in the smaller layout of Teen Chicago had a longer-than-average time and a slower sweep rate, providing evidence for the trend that smaller exhibitions seem to engage visitors for longer times per square foot than larger exhibitions.
Exceptionally Thoroughly Used Exhibitions
In the far-right of Quadrant D of the model are the exhibitions that were exceptionally thoroughly used, defined by the criteria references of having a %DV greater than 51% and an SRI below 300. These criteria were derived from T&T data from a seminal summative exhibition study that “set the bar” for SRI and %DV metrics reflecting unusually high visitor use (Serrell 1991). At that time, these guidelines were thought to be surprisingly low. Many practitioners and evaluators without experience with T&T methods and data had unrealistic assumptions about how visitors typically used exhibitions. With the 1998 database, it became clear how uncommon thoroughly used exhibitions were. In the 2009 database there were seven.
These seven exhibitions ran the gamut of exhibition characteristics: large and small spaces (from 1,200 to 12,000 square feet); content involving science, nonscience, and science fiction; real objects and no objects; and free and ticketed shows. The one characteristic they shared in common was having relatively fewer exhibit elements compared to the exhibitions in the other quadrants.
Many other interesting factors contributed to these exhibitions being thoroughly used: highly popular topics (Star Wars, Egyptian Mummies); exhibits that afforded looking carefully and closely (Amber: Window to the Past); a compelling story of worldwide concern (The Endurance: Shackleton's Legendary Antarctic Expedition); strong local appeal (Kachemak Bay, Alaska: An Exploration of People and Place) and destination visitors (Animal Eyes, left); and highly interactive (Playground).
Popular topic, ticketed entrance
Star Wars, a large ticketed exhibition of an iconic pop culture subject, attracted visitors with high prior interest. Even without a special interest, when visitors have to buy a ticket, it usually means that they will stay longer because they want to get their money’s worth. In Star Wars, the average time spent was 58 minutes. But the main factor that likely contributed to the high percentage of diligent visitors was that there were only 37 exhibit elements.
Beautiful small objects
Small, precious, attractive, or curious objects with infinitesimal detail motivated visitors to look closely at them in Amber: Window to the Past in its installation at the Milwaukee Public Museum. Exhibit elements dealing with art, science, and natural history totaled 34, which was not overwhelming. Amber originated at New York City’s American Museum of Natural History (AMNH), where it also was rated thoroughly used by visitors. Tracking-and-timing data from this venue have been remarkable in evidence for attracting and holding visitors’ attention, including the The Endurance: Shackleton's Legendary Antarctic Expedition and The Nature of Diamonds exhibitions. Is it because the NYC visitors are devoted followers of the AMNH special exhibitions? Or is it because the AMNH has developed the ability to create exhibits that are engaging, reinforcing, and meaningful to many visitors? Probably both. The fact that the T&T data from other museum venues that have shown and evaluated AMNH exhibitions also have relatively high %DV and slow sweep rates testifies to the positive experiences afforded by AMNH’s exhibitions.
Emotionally rich, answered visitors’ questions
Wendy Meluch (2004) conducted the extensive multimethod summative evaluation of Kachemak Bay, Alaska: An Exploration of People and Place at the Pratt Museum in Homer, Alaska. (2) She gave many reasons for the intensive use by visitors to that exhibition, which had the lowest sweep rate of all:
- People who come all the way to Homer (“the end of the road”) have made a commitment to being there. They tend to be really motivated visitors.
- Previous research shows the Pratt's audience to be highly educated and very accustomed to visiting museums on their travels.
- Staff tied all exhibit messages to questions that people routinely have about life in the area.
- The community-based videos are engaging and have seating. Some people will sit and watch all of them, and many weep. (Staff had to put out tissues and a waste basket.)
Destination visitors
Animal Eyes was used slowly and thoroughly by visitors at WISTEC, a small science museum (now called The Science Factory) in Eugene, Oregon. People who came for the afternoon tended to stay and engage with a majority of the elements that dealt with the type, number, and position of animal eyes compared with humans. While not exactly at the end of the road, at the time the museum had only one main gallery and little competition for visitors and their leisure time in Eugene. The audience seemed to be very intentional destination visitors, like the ones to the Pratt.
Multiple stations of the same open-ended activity
Playground, at the Tech Museum, had multiple stations of the same exhibit to increase visitor accessibility to the highly interactive and open-ended experiences about the nature of play behavior. Thus, the number of elements in the exhibition (seven) was fewer than the number of exhibit units on the floor of the 4,400-square-foot gallery. Seventy-eight percent of the visitors used at least four of the seven exhibits for an extended time. The strategy of making multiple stations was intended to give more visitors the opportunity to use them without having to wait in line.
Recommendations for More T&T Studies
The metrics of sweep rate index (SRI) and diligent visitors (%DV), published with extensive examples in Paying Attention: Visitors and Museum Exhibitions, have been incorporated into museum visitor studies by at least 12 other researchers. The lexicon is appearing more often and is referred to in many summative evaluations of NSF programs. I hope that as more researchers adopt these metrics, the numbers will become even more useful for comparisons, predictions, planning, and assessment.
Tracking-and-timing data from recent studies reinforced a trend that was hinted at in the 1998 baseline meta-scattergram: that more science museum and science center exhibitions are represented in the lower %DV ranges. Are the open floor plans and the “playground” atmosphere of science centers encouraging incomplete and disjointed use by visitors? Exhibitions with narratives and themes--as promised in many grant proposals--need to be used more thoroughly to communicate effectively. I think science exhibit developers should be creating experiences that foster more integrated learning experiences, with fewer isolated individual elements, and that afford conceptually coherent exhibits that build on each other in ways that reinforce and reward diligent behavior. (3)
While visitors’ prior knowledge, motivation, and social group can be important factors in predicting their behavior, the contingencies in the exhibit environment (that is, all aspects of the exhibition design) are also key variables--ones that exhibit planners can make the most of. “It is, after all, the learning environment that is under the control of the museum” (Leinhardt and Knutson 2004). Museums can’t change who visitors are, but museums can offer them better opportunities to become engaged with more of the exhibits.
When does “lots” become “overwhelming”? For many institutions and special exhibitions, the number of people who can come back again for another look at a large temporary display before it leaves town is probably not as great as exhibit developers assume. Temporary exhibitions with more than 50 elements can be overwhelming for visitors who want to “see it all.” When planning a temporary exhibition, thinking of the visitor experience as a one-time event is probably more realistic.
Exhibit developers can use the meta-scattergram to compare their summative T&T data to other exhibitions and to think about their goals for existing, new, or old exhibitions. They can use it to envision environments and visitor behaviors that would encourage better results. Where should their exhibition be on the scattergram? That is, what sweep rate index and percentage of diligent visitors are intended or desired? It is possible, without compromising budgets or creativity, to even be in the “exceptionally thoroughly used” area. Raise the bar!
It does not cost more to make a thoroughly used exhibition. In fact, it might cost less, since exhibitions with fewer elements seem likely to be used more thoroughly than those with more elements. More time and resources can be focused on planning and formative evaluation, with less time spent on adding content for the elusive “more-interested visitor”--that one person who stopped at the exhibit ignored by the other 99 people. Smaller exhibitions with well-evaluated exhibit elements will be more likely to appeal to a broader audience.
Finally, I hope that more practitioners will get out there and watch people. Systematically record their behaviors, and see what abundance of evidence and impacts can be measured to justify the time, intentions, and money spent. And please, publish and show and share the data.
All of us working in informal science education want to be effective at reaching our audiences. Paying attention to where and how people pay attention helps us do that better. Experiences that are highly attractive and engaging can be rewarding to the users and to the creators alike.
NOTES
(1) Tracking and timing should not be confused or equated with making “sweeps” of the exhibit every 10 minutes, doing focused observations on single elements, or videotaping visitor behaviors. Neither is it the same as cuing visitors or doing participant observation. Those are different methods for gathering time and visitor-use data primarily for individual exhibits, whereas unobtrusive tracking and timing gathers the most complete, reliable, and comprehensive data about time and use of whole exhibitions.
(2) The seminal study in 1991 that was the genesis of the SRI and %DV metrics and that set the benchmarks of SRI 300 and 51%DV was of the exhibition Darkened Waters, also created by the Pratt Museum.
(3) This statement leads the reader to ask, “How do I do that?” and some of the answers can be found in the recommended readings below.
References And Citations In The Text By AUTHOR NAME
Allen, S. (2002). Looking for Learning in Visitor Talk. In Leinhardt, G., Crowley, K., and Knutson, K. (Eds.), Learning Conversations in Museums (pp. 299). Hillsdale, NJ: Erlbaum.
Allen, S. (2007). Secrets of Circles. In-house report, Children’s Discovery Museum of San Jose, CA.
Allen, S. (2008). Evaluating Exhibitions. In Framework for Evaluating Impacts of Informal Science Education Projects (pp. 54). Arlington, VA: National Science Foundation, DEHR, DRL.
Borun, M., Dritsas, J., Johnson, J., Peter, N., Wagner, K., Fadigan, K., Jangaard, A., Stroup, E., and Wenger, A. (1998). Family Learning in Museums: The PISEC Perspective. Philadelphia: PISEC c/o The Franklin Institute.
Cohn, S., and Phipps, M. (2009). Water, Comparative Timing and Tracking Report. In-house report, Science Museum of Minnesota.
Csikszentmihalyi, M., and Hermanson, K. (1995). “Intrinsic Motivation in Museums: What Makes Visitors Want to Learn?” Museum News, 74/(3), pp. 36.
Friedman, A. (Ed.) (2008). Framework for Evaluating Impacts of Informal Science Education Projects.
Gutwill, J. (2000). Revealing Bodies Summative Evaluation Brief. In-house report, Exploratorium, San Francisco.
McEver, Catherine. (2007). Listen: Making Sense of Sound. In-house report, Exploratorium, San Francisco.
Randi Korn & Associates. (2004). Invention at Play. In-house report, Lemelson Center for the Study of Invention and Innovation (NMAH), Smithsonian, Washington, DC.
Randi Korn & Associates. (2007a). RACE Are We So Different? In-house report, American Anthropological Association, Arlington, VA.
Randi Korn & Associates. (2007b). Courbet and the Modern Landscape. In-house report, Walters Art Museum, Baltimore.
Leinhardt, G., and Knutson, K. (2004). Listening in on Museum Conversations. Walnut Creek, CA: AltaMira Press. pp 160.
McNamara, P. (2005). Amazing Feats of Aging. In-house report, Oregon Museum of Science and Industry, Portland.
Meluch, W. (2004) Kachemak Bay, Alaska: An Exploration of People and Place. In-house report, Pratt Museum, Homer, AK.
Meluch, W. (2006). African Savannah Exhibit. In-house report, San Francisco Zoo.
Pekarik, A. (2005). Visitor Responses and Behaviors in the Kenneth E. Behring Family Hall of Mammals. Washington, DC: National Museum of Natural History, Office of Policy and Analysis, Smithsonian Institution.
Ross, S. (2005). Zoo Visitor Behavior at an African Ape Exhibit. Visitor Studies Today, 8(1), 4-12.
Selinda Research Associates (2002). Underground Adventure. In-house report, Field Museum, Chicago.
Serrell, B. (1991). Darkened Waters: Profile of an Oil Spill. In-house report, Pratt Museum, Homer, AK.
Serrell, B. (1998). Paying Attention: Visitors and Museum Exhibitions. Washington, DC: American Association of Museums.
Serrell, B. (2002). Are They Watching? Visitors and Videos in Exhibitions. Curator 45(1), 50-64.
Serrell, B. (2004a). Memory: A Three-Site Study. In-house report, Exploratorium, San Francisco.
Serrell, B. (2004b). Sports: You Shoulda Been There. In-house report, Chicago History Museum.
Serrell, B. (2005a). A Multi-site Study of Memory. Current Trends, 18, 44-53.
Serrell, B. (2005b). Teen Chicago. In-house report, Chicago History Museum.
Serrell, B. (2009). Furniture City. In-house report, Grand Rapids Public Museum, MI.
Sikora, M. (2009). New Roles for Evaluation at the Detroit Institute of Arts. Curator 52(1), 45-65.
Tisdal, C. (2007). Summative Evaluation of Star Wars: Where Science Meets Imagination. In-house report, Museum of Science, Boston.
Yalowitz, S., and Tomulonis, J. (2004). Jellies: Living Art. In-house report, Monterey Bay Aquarium, CA.
Yalowitz, S., and Ferguson, A. (2006). Sharks: Myth and Mystery. In-house report, Monterey Bay Aquarium, CA.
Yalowitz, S. and Bronnenkant, K. (2009). Tracking and Timing: Unlocking Visitor Behavior. Visitor Studies 12(1), 47-64.
References And Citations In The Text By EXHIBITION NAME
Amazing Feats of Aging: McNamara, P. (2005). In-house report, Oregon Museum of Science and Industry, Portland.
Animal Eyes: Serrell, B. (1999), In-house report, Museum of Vision (formerly Museum of Ophthalmology), San Francisco.
Beautiful Science: Serrell, B. (2009). In-house report , The Huntington Library, Art Gallery, Botanic Garden, and Conservatory. San Marino, CA.
Chicago Sports: Serrell, B. (2004). Sports: You Shoulda Been There. In-house report, Chicago History Museum.
The Endurance: Shackleton’s Legendary Antarctic Expedition: Giusti, Ellen (1999). In-house report, American Museum of Natural History, New York.
Egyptian Mummies: Koke, J. (1998). In house report, Denver Museum of Nature and Science, CO.
Exploring Life on Earth: Randi Korn & Associates. (2002). In-house report, Milwaukee Public Museum, WI.
Furniture City: Serrell, B. (2009). In-house report, Grand Rapids Public Museum, MI.
Hall of Mammals: Pekarik, A. (2005). In-house report, Office of Policy and Analysis, Smithsonian Institution, Washington, DC.
Hudson Riverama: Borun, M. (2004). In-house report, Hudson River Museum, Yonkers, NY.
Invention at Play: Randi Korn & Associates. (2004). In-house report, Lemelson Center for the Study of Invention and Innovation (NMAH), Smithsonian, Washington, DC.
Kachemak Bay, Alaska: An Exploration of People and Place: Meluch, W. (2004). In-house report, Pratt Museum, Homer, AK.
Memory: Serrell, B. (2004).Memory: A Three-Site Study. In-house report, Exploratorium, San Francisco.
Moneyville: Inverness Research Associates (2004). In-house report, Oregon Museum of Science and Industry, Portland.
Playground: Brown, G. (2003). In-house report, The Tech Museum, San Jose, CA.
RACE Are We Different?: Randi Korn & Associates. (2007). In-house report, American Anthropological Association, Arlington, VA.
Revealing Bodies: Gutwill, J. (2000). In-house report, Exploratorium, San Francisco.
Secrets of Circles: Allen, S. (2007). In-house report, Children’s Discovery Museum of San Jose, CA.
Star Wars: Tisdal, C. (2007). In-house report, Museum of Science, Boston.
Surviving: The Body of Evidence: Borun, M. (2008). In-house report, University of Pennsylvania Museum of Archeology and Anthropology, PA.
Teen Chicago: Serrell, B. (2005). In-house report, Chicago History Museum.
Water: Cohn, S., and Phipps, M. (2009). In-house report, Science Museum of Minnesota.
Yuungnaqpiallerput (The Way We Genuinely Live): Masterworks of Yup’ik Science and Survival: Serrell, B. (2009). In-house report, Anchorage Museum of History and Art, AK.
Recommended Readings
Summative evaluation reports with details of T&T that are integrated into other methods of summative evaluation
Allen, S. (2007). Secrets of Circles. In-house report, Children’s Discovery Museum of San Jose, CA.
Randi Korn & Associates. (2007). RACE Are We Different? In-house report, American Anthropological Association, Arlington, VA.
Serrell, B. (2005). Teen Chicago. In-house report, Chicago History Museum.
Yalowitz, S., and Ferguson, A. (2006). Sharks: Myth and Mystery. In-house report, Monterey Bay Aquarium, CA.
Tracing the history and evolution of SRI and %DV metrics
Serrell, B. (1992). The 51% Solution: Defining a Successful Exhibit by Visitor Behavior. Current Trends, 6, 26-30.
Serrell, B. (1993). Using Behaviour to Define the Effectiveness of Exhibitions. Museum Visitor Studies in the 90s. London: Science Museum.
Serrell, B. (1997a). Paying Attention: The Duration and Allocation of Visitors’ Time in Museum Exhibitions. Curator, 40(2), 108-125, Serrell, B. (1997b). Time is Indeed of the Essence. Curator 40(4), 253-255.
Serrell, B. (1998). Paying Attention: Visitors and Museum Exhibitions. Washington, DC: American Association of Museums.
How to conduct tracking and timing studies
Serrell, B. (1998). Paying Attention: Visitors and Museum Exhibitions. Washington, DC: American Association of Museums.
Yalowitz, S. and Bronnenkant, K. (2009). Tracking and Timing: Unlocking Visitor Behavior. Visitor Studies 12(1), 47-64. How to make and evaluate more visitor-centered exhibitions
McLean, K. (1993). Planning for People in Museum Exhibitions. Washington, DC: Association of Science-Technology Centers
Serrell, B. (1996). Exhibit Labels: An Interpretive Approach. Walnut Creek, CA: AltaMira Press.
Serrell, B. (2006). Judging Exhibitions: A Framework for Assessing Excellence. Walnut Creek, CA: Left Coast Press.
Sikora, M. (2009). New Roles for Evaluation at the Detroit Institute of Arts. Curator, 52(1), 45-65.
Appendix Description for 2009 T&T Database
There are 51 entries in the 2009 tracking and timing database of summative evaluation data in museum exhibitions. Many summative evaluation reports were reviewed for the inclusion of the data needed for the T&T comparisons. Often data are incomplete or not reported.
Data for 50 exhibitions are shown on the meta-scattergram. The outlier, Hall of Mammals, is not shown and was not used to calculate the average SRI or %DV. For a copy of the Excel document that includes the data below, contact baserrell@gmail.com
Date is the year the evaluation study was done.
Author is the author of the paper, either the name of the individual or the consulting firm. Not all authors are listed in all cases.
Exhibition is the name of the museum exhibition, usually the same as the name of the report.
Institution is the name of the sponsoring agency for the report or the location of the exhibition where the T&T data were collected.
Type is the kind of exhibition/institution.
Sq. ft. is the square footage of the exhibition (usually a wall-to-wall measurement).
# elements is the number of exhibit elements in the exhibition, if known.
Av. time is the average (mean) total time in minutes spent by the unobtrusively tracked sample of visitors in the exhibition.
SRI is the sweep rate index, the square footage divided by the average time. SRI can be computed if average total time and square footage were given.
%DV is the percentage of visitors who stopped at more than half of the exhibit elements. In some cases the %DV is a rough estimate based on the average or median number of stops made by visitors and the number of exhibit elements, if given.