Measuring Behavioral Outcomes Using Follow-Up Methods
How do evaluators of informal science projects use follow-up data collection methods to examine behavioral impacts? I explored this question while serving as an evaluation intern at the Science Museum of Minnesota in the fall of 2013. My project drew on the evaluation reports uploaded to InformalScience.org and the coding framework developed and implemented through the Building Informal Science Education (BISE) project.
The Sample I Used
The sample for this analysis was drawn from an early version of the BISE database that included 384 evaluations of STEM informal learning projects that were posted to InformalScience.org on or before January 31, 2012. Due to the time constraints of the internship, I decided to limit my sample to summative evaluations of in-person experiences for public audiences. From here, I only looked at reports that used follow-up measures, which were defined as follow-up data collection some time after an experience with an exhibit or program. Finally, the sample was limited to reports that studied behavioral impacts. To determine whether a behavioral impact was examined during an evaluation, I analyzed the questions that were asked during the follow-up and used Friedman’s (2008) framework to infer the type of impact that the study sought to capture. This process resulted in a sample of 20 reports for my analysis. Although this analysis focuses on behavioral impacts, many of the reports also collected follow-up data related to other types of impact.
The Sample Characteristics Table includes an overview of each of the 20 studies in the sample including the evaluand type, project setting, behavioral impact categories studied, data collection methods used to gather follow-up data, and time period for follow-up. The table also includes a link to each report on InformalScience.org and the corresponding BISE database number (which will help you find a report in the BISE database when it is disseminated this summer).
How Evaluators Gathered Follow-Up Data
Evaluators measuring behavioral impacts used a variety of data collection methods to gather follow-up data, as illustrated in Figure 1. The most common methods were online surveys and telephone interviews, which were each used in half of the reports. In almost half of the reports (45%), evaluators used more than one data collection method to gather follow-up data.

Figure 1: Data Collection Methods (n=20)
The amount of time between the visitor’s experience with the exhibit or program and the collection of follow-up data ranged from two weeks to eight months (see Figure 2). In several reports, the evaluation followed up on a long-term program. Although the evaluation was conducted at a single point in time, the participants had joined the program at different points in time. Therefore, the time between the participant’s experience and the collection of follow-up data varied. These reports are designated as Other.
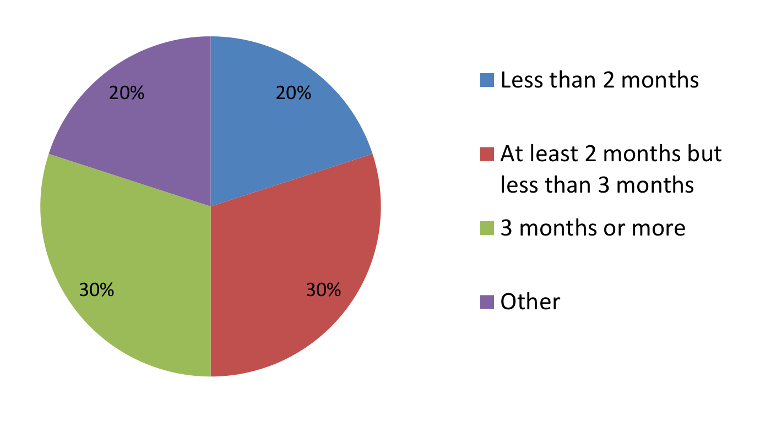
Figure 2: Time Period Follow Up (n=20)
The Types of Behavioral Impacts Studies
This analysis sought to explore the types of behavioral impacts that were studied in this sample of evaluation reports. To address this, the questions asked during the follow-up were analyzed to infer the behavioral impacts that they sought to capture. The questions were organized according to themes and then compared with impact categories described by Ballantyne et al (2011), Bell et al (2009), and L. Wilson (personal communication, December 8, 2013).
This process identified 11 categories of behavioral impacts in the sample (see Table 1). A 12th category, Unspecified, was used for questions that were designed to elicit general behavior-related information (e.g., Flagg & Knight-Williams, 2008). The Unspecified category was also used for questions which probed goals or activities that were determined by program participants and, therefore, varied across respondents. For example, in one report participants had read newspaper articles of their choice and were asked the extent to which they were motivated to change their behavior as a result of those articles (Yalowitz, 2009).
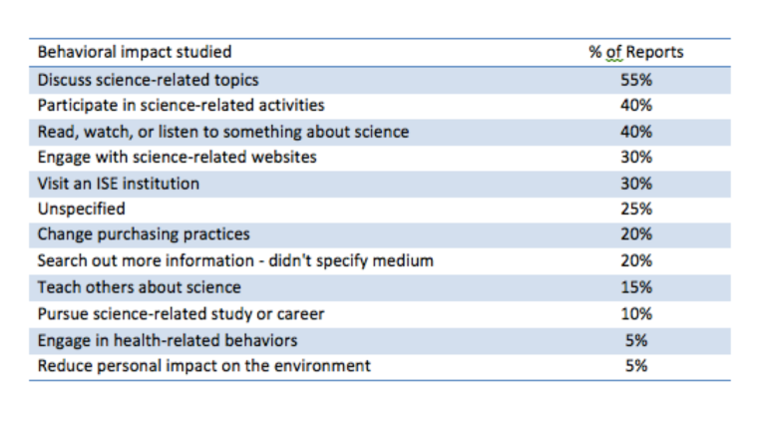
Table 1: Behavioral Impacts Studied. (n=20)
The most common category of behavioral impact was discussing science-related topics with others (55%). Most frequently, these studies sought to determine whether participants had discussed the exhibit or program since visiting (e.g., Yalowitz, 2006) or had discussed the topic that the exhibit or program explored (e.g., Flagg & Knight-Williams, 2008). Some evaluations examined whether respondents had engaged in science-related conversations more generally. For example, one study asked respondents how frequently they talked to family and friends about science (Sickler & Johnson, 2009).
Another common behavioral impact studied was participation in science-related activities (present in 40% of the sample). The activities in this category varied across the sample and included participation in citizen science projects (e.g., Serrell & Associates, 2006), attending science lectures or programs (e.g., Storksdieck, Haley-Goldman, & Cohen Jones, 2002), and engaging in specific science-related hobbies (e.g., Yalowitz, Foutz, & Danter, 2011). One study included science- or technology-related tasks including fixing an electric appliance or using an instrument such as a barometer or voltmeter (Campbell, Carson, & Kibler, 2006)].
More than a third of the reports in the sample (40%) studied whether or how frequently respondents read, watched, or listened to something about science. This included reading science books, newsletters, or magazines (e.g., Campbell, Carson, & Kibler, 2006); watching science-related video or TV programs (e.g., Peterman, Pressman, & Goodman, 2005); and listening to science-related podcasts or radio programs (e.g., Storksdieck, Haley-Goldman, & Cohen Jones, 2002).
Most evaluations in this sample measured more than one behavioral impact category, ranging from one to six categories. As illustrated in Figure 3, around half of the reports (55%) studied one or two behavioral impact categories, while the other half (45%) examined three to six categories.
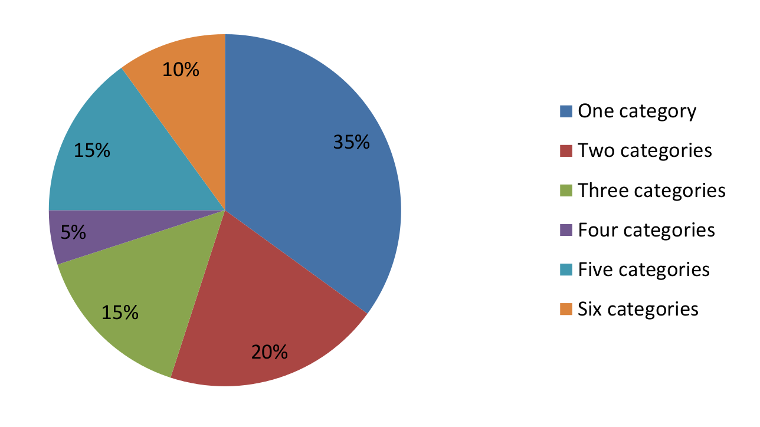
Figure 3: Number of Behavioral Impact Categories Measured per Report (n = 20).
Conclusion
As a science librarian and evaluation student, I found the BISE evaluation reports to be a valuable resource for learning how ISE evaluators use follow-up data collection methods to examine behavioral impacts. As I examined these reports, I expected to find patterns that might reveal a typical study design or might link specific follow-up methods with certain categories of behavioral impacts. Instead, I discovered a rich variety of study designs, data collection methods, and behavioral impact categories.
I summarized the reports in the Sample Characteristics Table in order to help myself and others zero in on examples of the different approaches used to study behavioral impacts. This sample of reports is not representative of the field of informal science or evaluation. Rather, it provides a snapshot of how contributors to InformalScience.org have approached the study of behavioral impacts. I look forward to using the reports in this snapshot to inform the design of my own follow-up studies in the future.
Are you curious about the types of behavioral impacts that evaluators are examining? Are you designing a follow-up study of your own and deciding what data collection technique to use? Are you crafting interview or survey questions to capture a specific behavioral impact? Digging into these reports can help inform your thinking and connect you with examples from other evaluators in the field.
References
Ballantyne, R., Packer, J. & Falk, J. (2011). Visitors’ learning for environmental sustainability: Testing short- and long-term impacts of wildlife tourism experiences using structural equation modeling. Tourism Management, 32, 1243-1252.
Bell, P., Lewenstein, B., Shouse, A., & Feder, M. (Eds.). (2009). Learning science in informal environments: People, places, and pursuits. Washington, D.C.: National Academies Press
Friedman, A. (2008). Framework for evaluating impacts of informal science education projects.